stanford-imaging team mailing list archive
-
 stanford-imaging team
-
Mailing list archive
-
Message #00012
Question on Matlab
Dear All,
I have a question on Matlab and I appreciate if any of you could comment on this if you have prior experience in what I want.
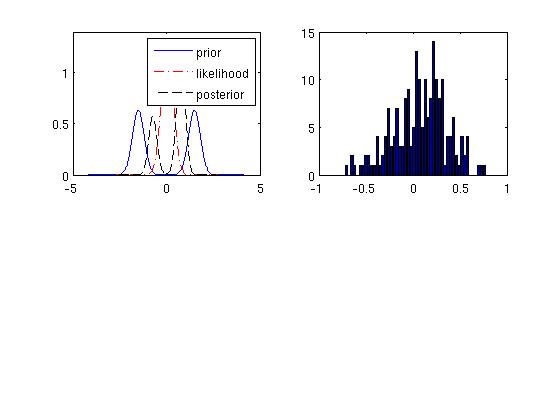
I have bunch of scalar data and I need to sketch the PDF of it. I am familiar with "hist" and "bar" functions in Matlab where basically you create some bins and put the data in there. However, I would want to draw only a curve that represent pdf and do not need the "bars"...In other words, I need to draw a curvilinear line that joins the top of these bars (in some sense)...Any idea on this would be much appreciated. any Matlab function?
To clarify what I mean, I also attached a jpg image (I want the form on the left not on the right in that picture)
Bests,
Hatef
--------------
Hatef Monajemi
PhD Student
Environmental Fluid Mechanics and Hydrology
Department of Civil and Environmental Engineering
Stanford University
473 Via Ortega, Y2E2 Bldg, Room M25
Stanford, CA 94305
Email: monajemi@xxxxxxxxxxxx
Web: http://www.stanford.edu/~monajemi/
Attachment:
pdfs.jpg
Description: JPEG image
Follow ups